

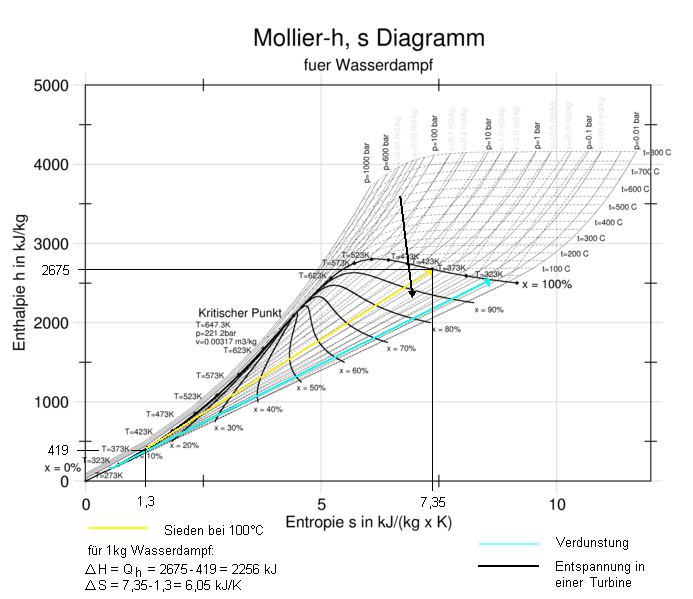
T,s - und h,s Diagramm / Wasser
h-s Diagramm Wasser
bei The Engineering ToolBox
bei wikipedia
als PDF-Datei bei www.chemicalogic.com
bei Amazon: Mollier-s-Diagram-Water-Steam-fold-away
bei Amazon: International-Steam-Tables-Thermodynamic-Supplemetary
bei wikipedia
als PDF-Datei bei www.chemicalogic.com
bei Amazon: Mollier-s-Diagram-Water-Steam-fold-away
bei Amazon: International-Steam-Tables-Thermodynamic-Supplemetary
| ||||||||||||||||

Labels: carnot, thermodyn, thermodynamik
<< Home